Web Energy Logger
- - What is the WEL?
- - How does it work?
- - Purchase Online
- - User Map / Info.
- - OurCoolHouse
Tech Support
WEL Logging (Users)
WEL Display (Users)
What is the Web Energy Logger? (WEL)
Simply put, the Web Energy Logger (or WEL) is the most economical way to monitor lots of temperature sensors, plus a host of other energy related devices in your home or office. It's ideal to verify the performance of a solar thermal system, or to calculate the efficiency of a geothermal installation, or even to prove that your home really is Net Zero. (User Guide.)
Not only does the WEL give you a window into your energy environment, but it also provides a live snapshot of your system, and a range of trend charts that you can share on the WEB in real-time.
Finally, the WEL records all your sensor data in monthly log files that are easy to download and import into programs like Excel. It's compact, versatile, and extremely configurable.
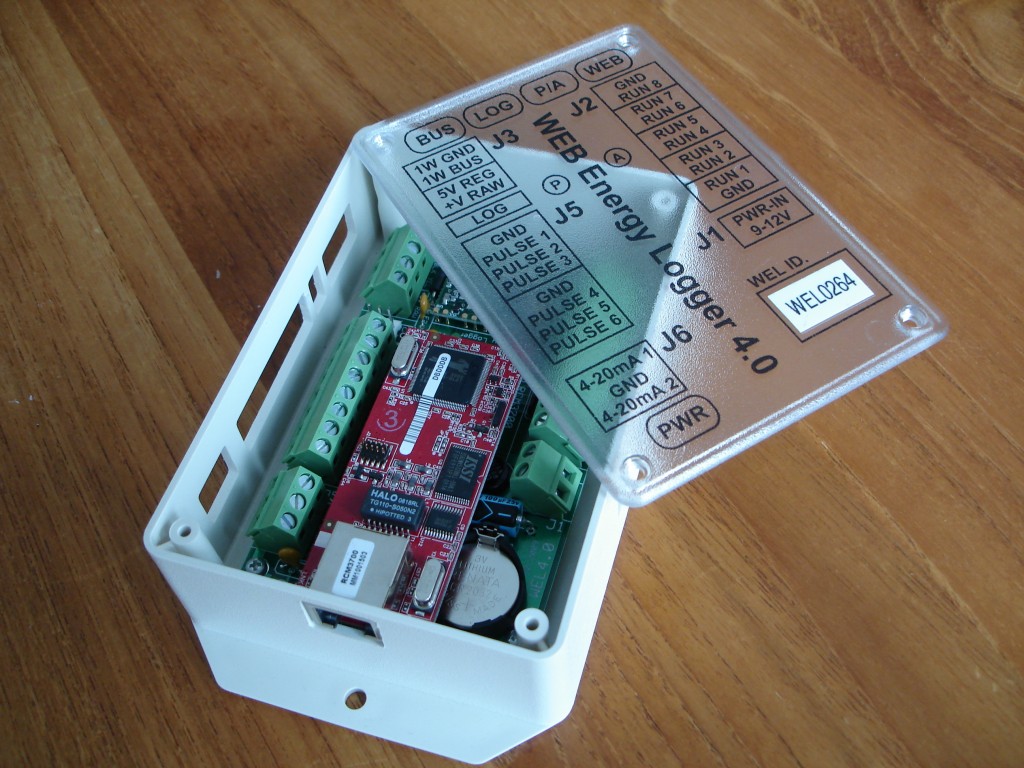
 The
minimal WEL in a Box (above) is ideal for a DIY'er, and
costs $395.
The
minimal WEL in a Box (above) is ideal for a DIY'er, and
costs $395.
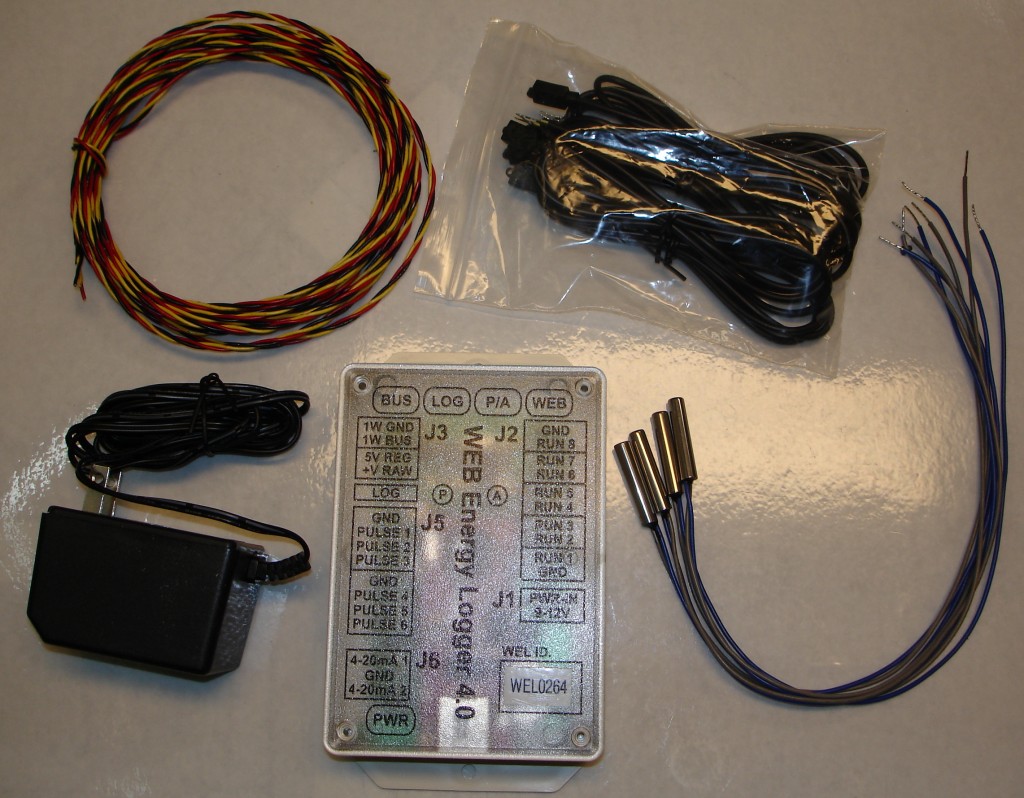
In contrast, the more complete WEL Starter Kit (right) is ready to run out-of-the-box with 10 temperature sensors and costs $535. All WEL's come with full monitoring software on the board, and a dedicated WEL logging site included in the price. For the full range of components and prices visit our online store.
Visit our Map page to see where the WEL is being used, and watch some live data
A little history:
The WEL is the fourth generation of the HVAC monitoring system that I originally designed for my Energy Efficient home in the mountains of western Maryland, and it's optimized for people who want to build their own monitoring system.
When I designed the energy systems for my home, I needed to ensure that they were performing as anticipated. Since I had incorporated Passive Solar design, Geothermal heating and cooling, Energy Recovery Ventilation and a Radiant Hydronic slab there was a lot to monitor and record. So I needed a system with lots of sensors at reasonable cost. I've designed and built a bunch of remote sensor systems in my robotics career, so I knew that the cost of lots sensors and input channels was going to be a big problem. When I came across the Dallas (now Maxim) 1-Wire sensor bus, I knew I'd found the ideal technology. These digitally addressable sensors all share one pair of wires, so they gave me the ultimate in flexibility and economy. I just strung a single twisted-pair throughout the house, and snapped on sensors wherever I needed them.
The first generation WEL was a clunky dedicated PC. The second generation was an embedded processor on a prototyping board. The third generation was an embedded processor on a custom designed interface board. The latest design (WEL 4.0) adds more pulse counter channels and brand new analog inputs. The Web Energy Logger is as low-cost, versatile, and easy-to-set-up as I can make it.
Here are the basic steps for installing and running a WEL.- Decide what you
want to monitor. The
WEL's main strength is reading LOTS of temperature sensors, but it also reads
six pulse channels, eight contact closures and
two 0-10V Analog inputs without any additional hardware.
By adding sensors to the 1-wire bus, you can also read humidity and solar
values, as well as sensing when any of your high power devices are running
(like pumps and heaters). So make a list of all the sensor
"points" that you want to log.
- Order the WEL and sensors you need. The "WEL Starter Kit" is a great
way to begin temperature monitoring, it comes with the WEL in a cool plastic enclosure, a power supply,
40 feet of bus wire and ten temperature sensor probes. Then if you want, you can add specific components
from other manufacturers: like the WNB-3Y-208-P-300Hz WattNode Wattmeter
from Continental Control Systems, or the Humidity/Solar sensor from Hobby-Boards.com .
- When you order the WEL, you'll get a username and password to log into the
Owner Setup page of this website. Here you can specify your data archiving
requirements. Such things as:
What order your data gets recorded in the downloadable monthly log files.
How you want your sensor data displayed on a custom "System Diagram" you upload to the site.
What custom trend graphs you want generated.
- When your WEL arrives, you connect it to your home LAN and power it up.
Using the Web browser on your home computer you configure the board, and assign
names to each sensor as you add them to the 1-wire network. You can also add
simple expressions to combine several sensor values together (like to calculate
BTU's or Net Power use).
- Start running your 1-wire bus, and adding sensors. As you add each
sensor, you'll scan the bus and then assign a name to the device that
appears. Your sensors will immediately become available for charting
and logging.
- As the WEL runs it will sample the sensor bus and automatically connect out to the Internet and post your sensor data to the WELServer.com website (or one of your choice). WELServer will generate your system diagram and trend charts, and post them on your own WEL Data page. You can include these same images in your own website just by referring to their unique URL's.
Now start watching you system. Add new trend graphs as you need them, and share your data with the community. It's amazing what you can lean about your system that you never anticipated.